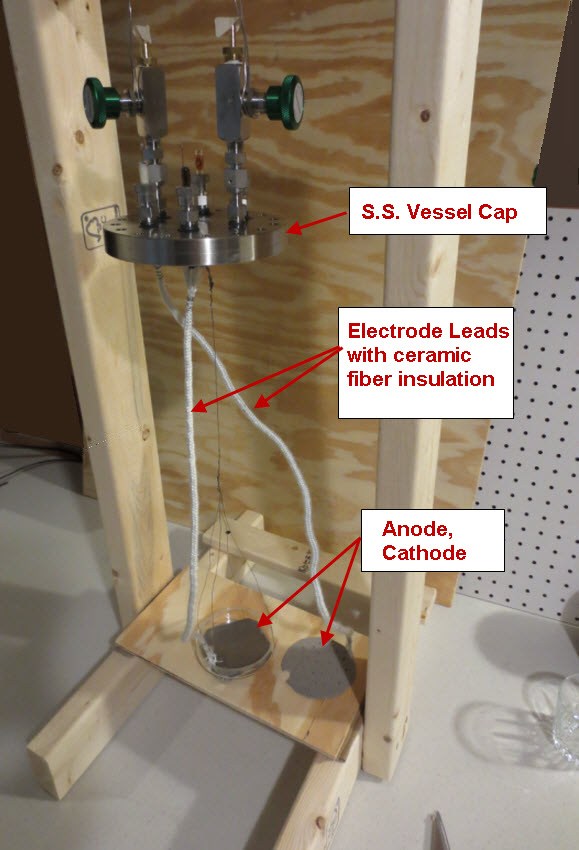
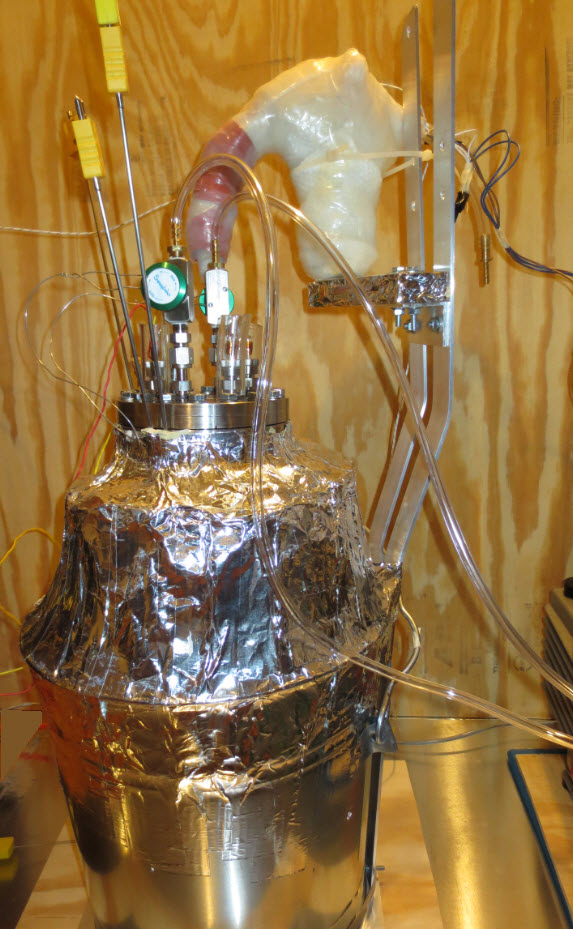
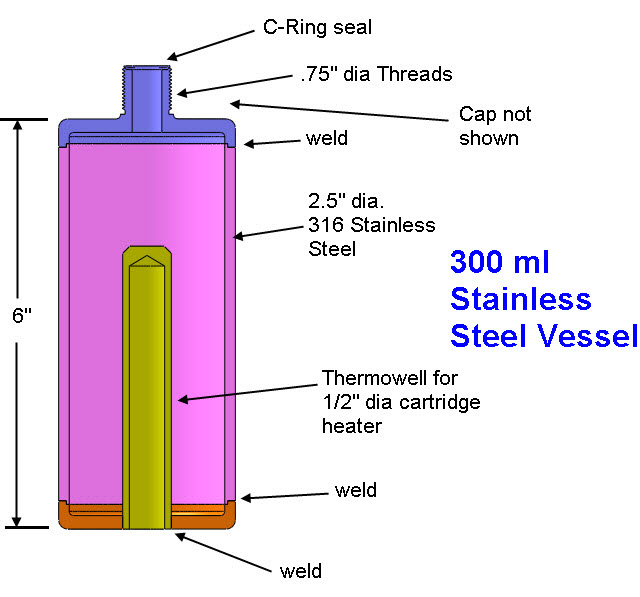
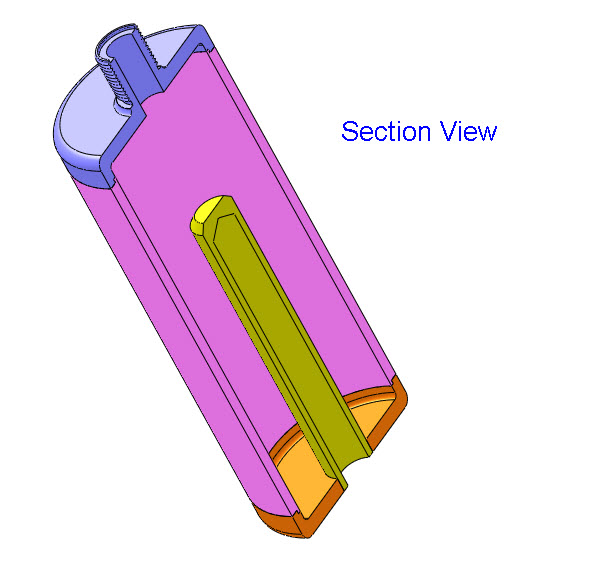
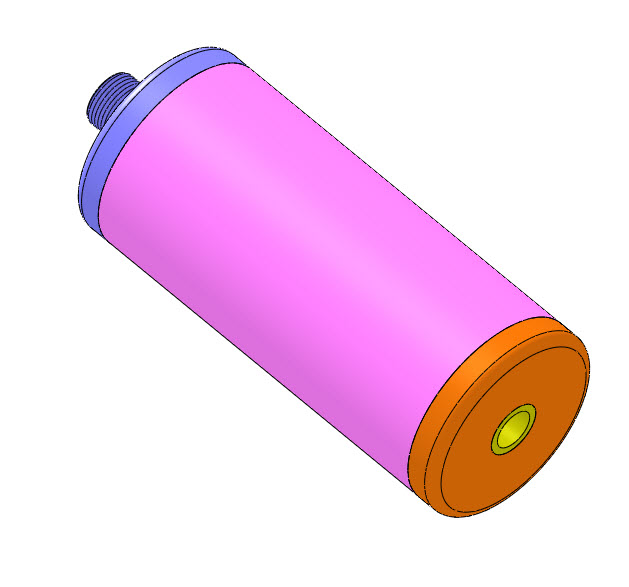
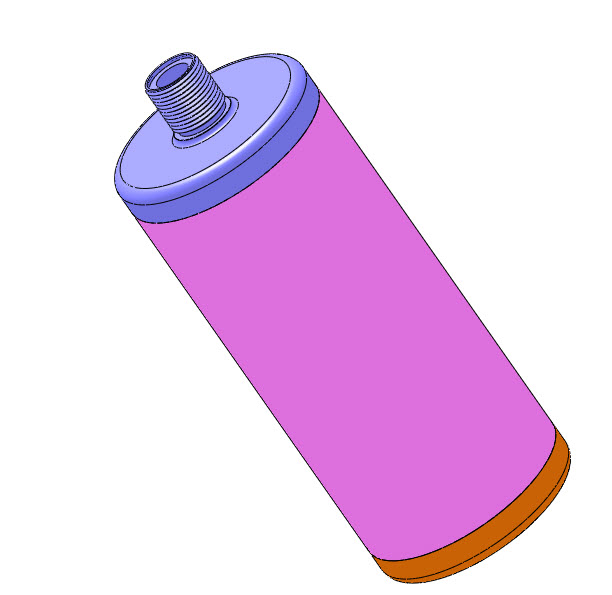
Blacklight Power’s CIHT electricity generating device.
BLP predicts that the CIHT can be scaled up to 3.3 kW of electrical power per liter based on their experiments. Here is a link to a BLP’s scientific paper on the CIHT device.
http://www.blacklightpower.com/wp-content/uploads/papers/CIHTElectrochemicalCell.pdf
Below is a report on my initial attempt at replicating BLP’s CIHT experiment.
=================================
Summary
An attempt was made to replicate Blacklight Power’s CIHT experiment. So far there has not been a successful replication but testing is continuing. Speculation on the causes of the lack of replication are:
1. The concentration of the water in the electrolyte is a key variable in the experiment based on Blacklight Power’s scientific papers and this unsuccessful replication may have an incorrect water concentration.
2. The anode is deep within the electrolyte at the bottom of a glass petri dish and the the water vapor needs to pass through a thin annular shaped area (or through the porous cathode mesh) to get to the anode. This could cause too much of a restriction to water vapor flow.
3. Potentially water is condensing at the top of the vessel where it is cooler and drying out the electrolyte. The top of the vessel may be between 70 C and 100 C (and condensing the water) while the electrodes and electrolyte is at 450 C at the bottom of the tall vessel.
4. The load resistance (R3 in Figure 1) was 12 ohms and possibly this should be either increased or decreased.
5. Some other unknown cause.
The first two issues listed above will be addressed soon by introducing more water vapor into the electrolyte (LiBr/LiOH/MgO) and giving it more time for it to be absorbed. Also, raising the temperature of the top of the vessel will reduce the amount of water that condenses, if that were happening.
Discussion
The output electrical energy was approximately 36% lower than the input electrical energy with the ratio of output to input being 0.64. This compares to Blacklight Power who had more than 10 times the electrical output compared to the electrical input in their CIHT experiment.
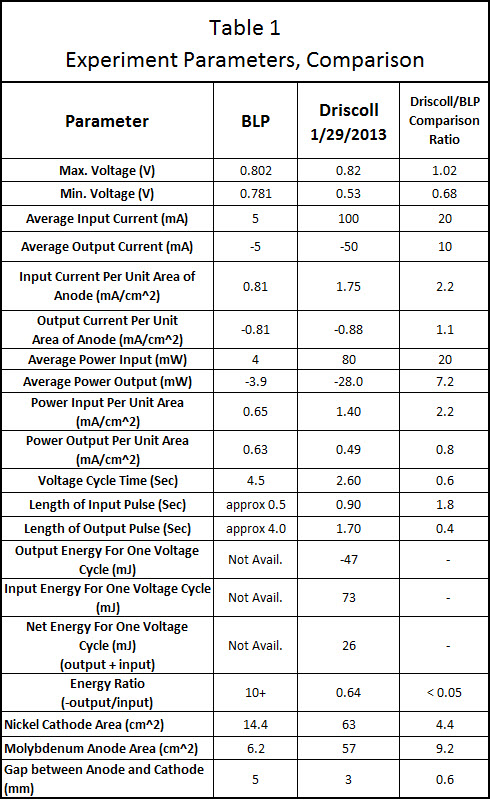
As seen in table 1, some measured parameters were close to Blacklight Power’s parameters but others were not. The input current on a unit area basis for the anode was somewhat similar to BLP’s being 1.75 mA/cm^2 for Driscoll and 0.81 mA/cm^2 for BLP. The output current on a unit area basis (anode) also was somewhat similar to BLP being -0.88 mA/cm^2 for Driscoll and -0.81 mA/cm^2 for BLP.
Experimental Setup
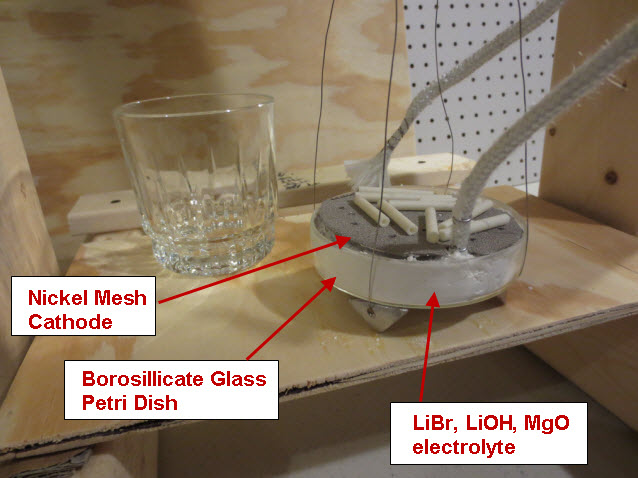
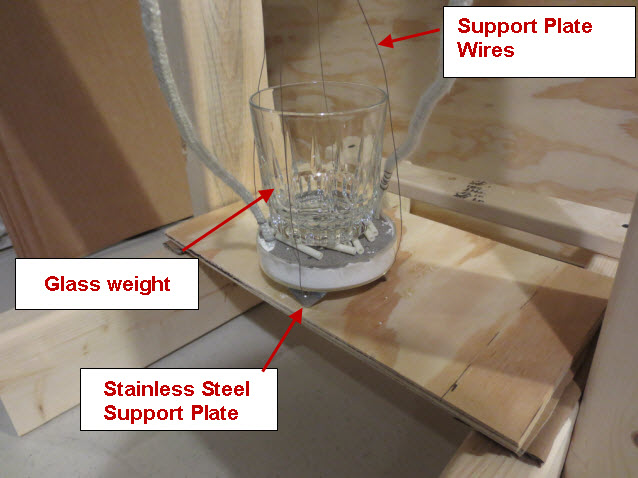
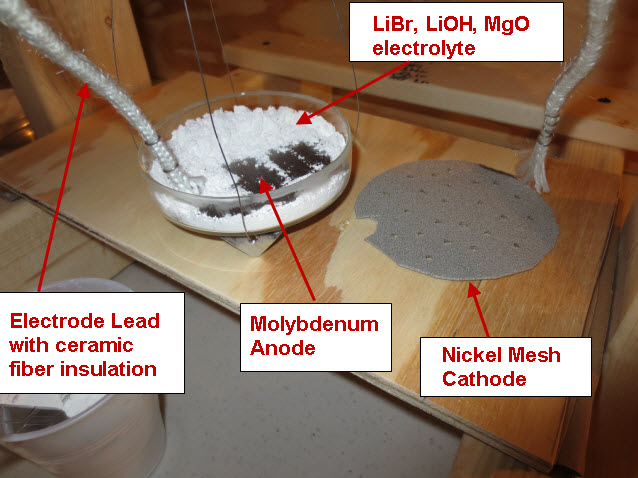
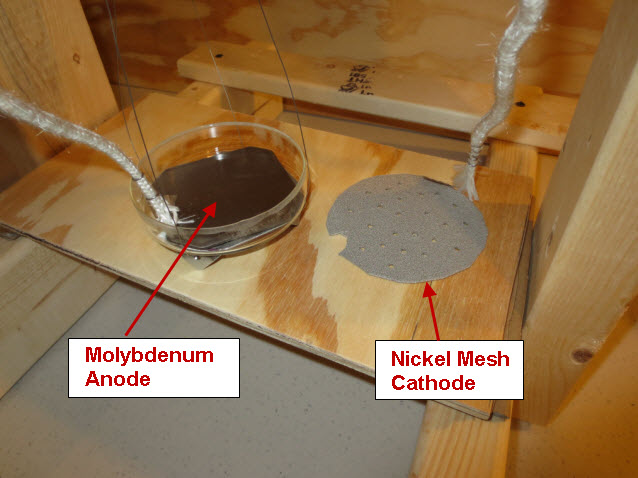
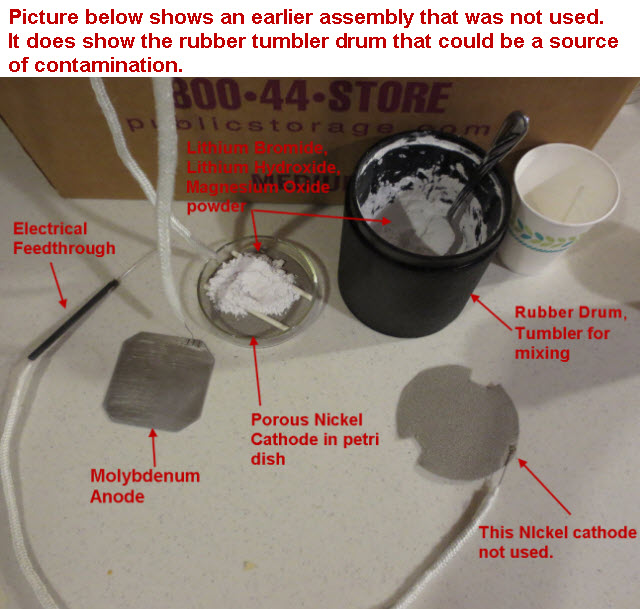
A solid Molybdenum anode having dimensions approximately 7.5 cm x 7.5 cm x .12 cm (56 cm^2) was placed in a borosilicate petri dish having a diameter of 10 cm. A porous Nickel cathode having a diameter of 9 cm (63 cm^2) was also placed in the petri dish. The electrodes were attached to wires that passed through a stainless steel vessel using electrical feedthroughs. Each feedthrough wire was made from the same material as the electrode that it was attached. A homogeneous electrolyte powder was created from 75 grams of Lithium Bromide (LiBr), 15 grams of Lithium Hydroxide (LiOH) and 30 grams of Magnesium Oxide (MgO) by putting them in a tumbler that uses a rubber drum along with ceramic balls and mixing them for 20 hours. A thick layer (approximately 9 mm) of the resulting electrolyte powder and 3 mm diameter ceramic spacers were placed between the Molybdenum anode and Nickel cathode. The purpose of the ceramic spacers was to prevent the anode from touching the cathode. A glass cup was used to weigh down the cathode so that the Nickel cathode would sink into the electrolyte as the electrolyte powder melted at its eutectic temperature of 275 C. It is unknown at this time what the final spacing between the electrodes was and it will be determined when the stainless steel vessel is opened up and the electrode assembly examined. At a maximum, the spacing was approximately 7 mm and at a minimum it was 3 mm based on the ceramic spacers between the electrodes.
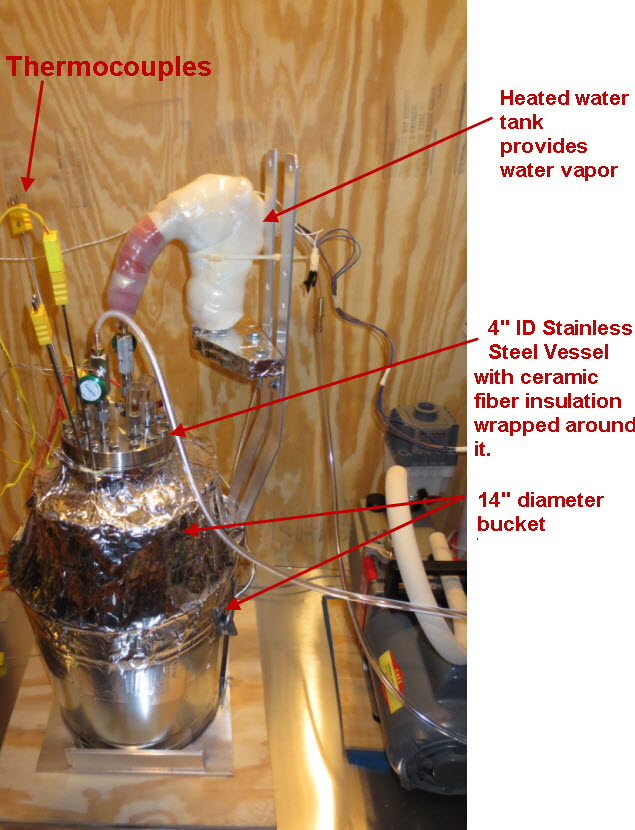
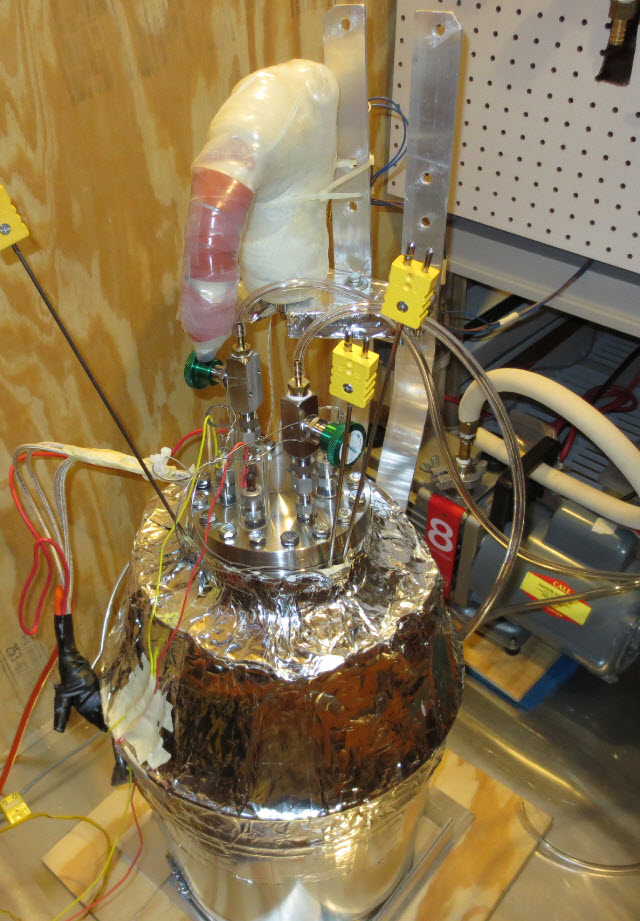
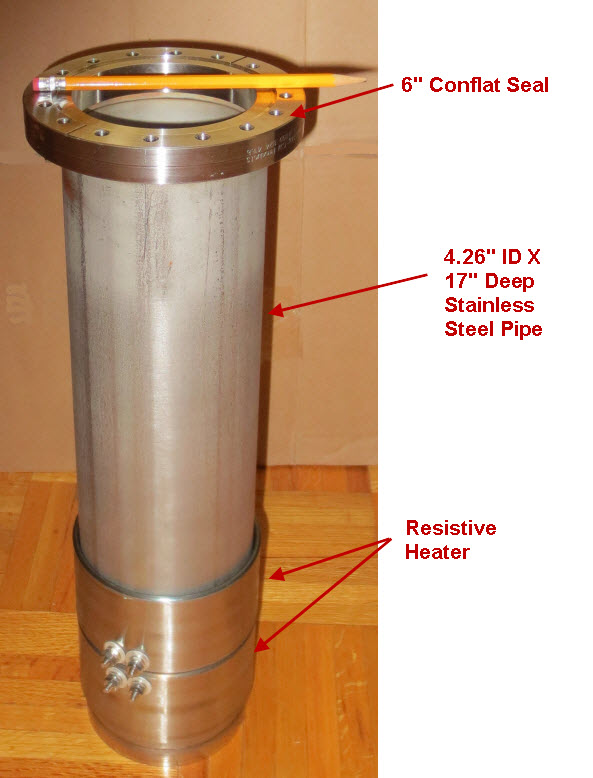
The petri dish, electrodes and electrolyte were placed in a stainless steel vessel having internal diameter of 10.6 cm and an internal height of 43 cm and having a 6” conflat seal at the top. Small cubes of ceramic fiber insulation were placed inside the vessel on top of the electrode assembly to act as an insulator between the electrodes and the top of the stainless steel vessel. Argon gas was used to purge the vessel of air. The bottom of the stainless steel vessel had an external electrical resistance heaters wrapped around it that heated the electrode assembly up to a temperature of 450 C. At times, water vapor was introduced into the stainless steel vessel through a heated line by flowing Argon gas at a rate of 22 ml/min over water heated to a temperature of 50 C. The Argon gas flow rate was controlled by a peristaltic pump. Gasses were allowed to escape the vessel through a water bubbler which isolated the vessel from the outside air.
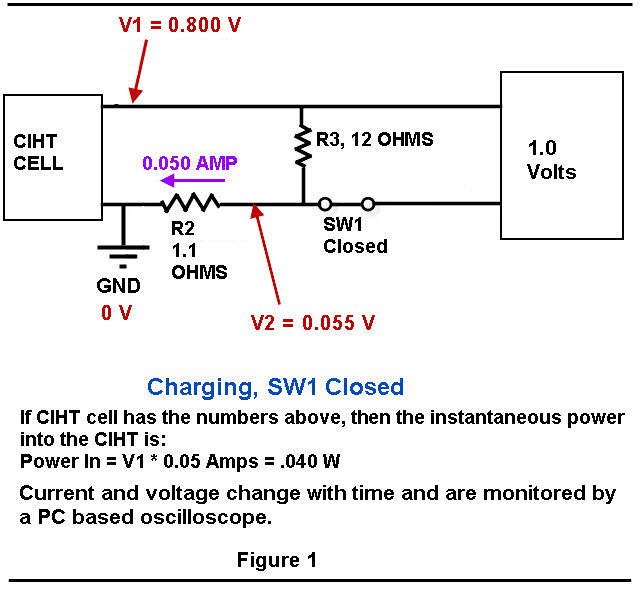
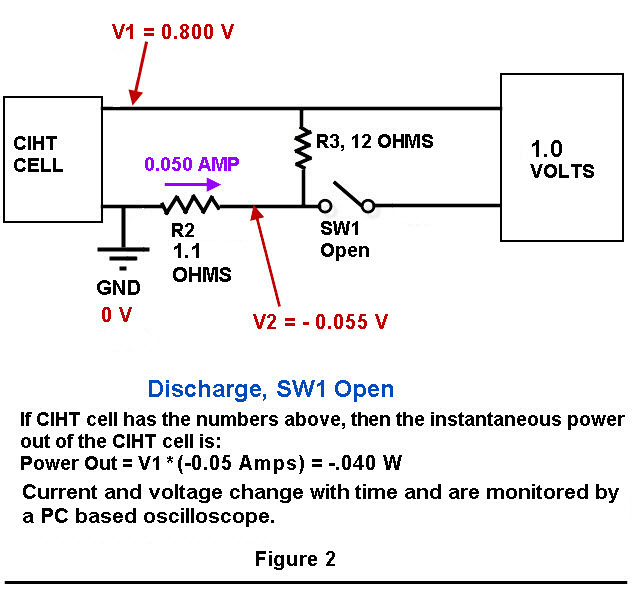
Figure 1 and Figure 2 show you a a schematic of the charging/discharging circuit. Not shown in Figure 1 and Figure 2 is a switch that disconnects the cell from resistors R2 and R3 during the time that experiment is not running.
The voltages were measured using a PC based oscilloscope from Pico Technologies, model 4224 running custom written VB.Net software for data acquisition and switch control. The switch relays have a USB interface, are magnetic reed style and are model “ProXR–Lite” from National Control Devices.
Data For Typical Voltage Cycle
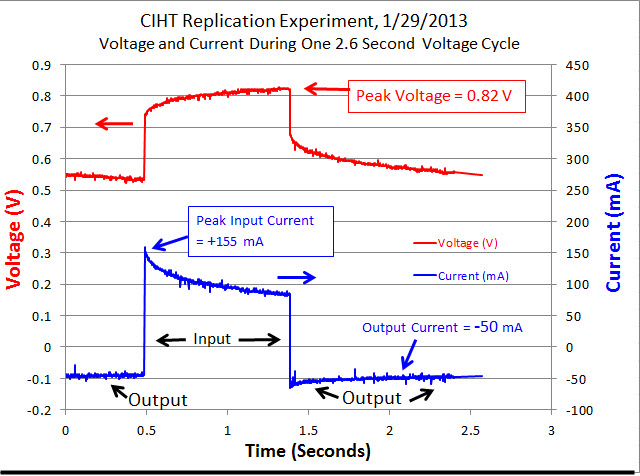
An input voltage pulse lasting 0.90 seconds was fed into the electrodes of the cell using the circuit depicted below in Figure 1 and Figure 2 by closing the switch labeled “SW1” for 0.90 seconds. After switch SW1 was opened, the cell automatically discharged through a resistance of 13.1 ohms (the sum of resistors R2 and R3) for 1.70 seconds. This voltage cycle was repeated continuously for 6 hours. The voltage peak was 0.82 Volts which was similar to BLP’s 0.802 Volts . The current during the output phase was typically -0.88 mA/cm^2 (based on the Molybdenum anode area) which is similar to BLP’s 0.81 mA/cm^2. The current during the input phase was 1.75 mA/cm^2 while BLP’s was 0.81 mA/cm^2 . On an absolute basis, the input current was an average of 100 mA and the output current was an average of 50 mA.
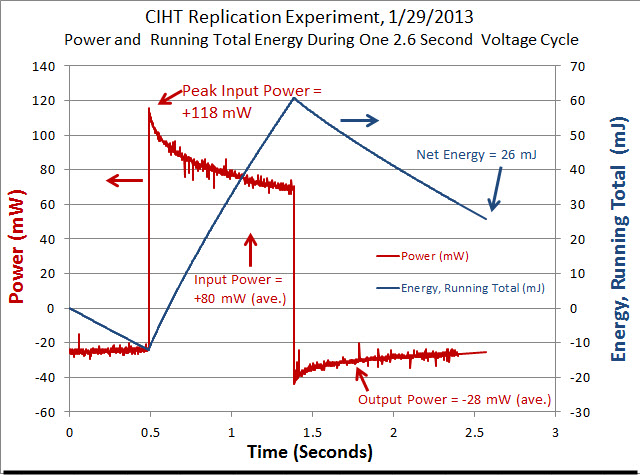
The average input power during a typical voltage cycle, which is indicated as a positive number on the graph, was approximately 80 mW for 0.90 seconds with a peak of 118 mW. The output power, which is indicated as a negative number on the graph, was an average of -28 mW for 1.70 seconds. As shown in Table 1, the typical input energy during one voltage cycle was 73 mJ and the output energy for that cycle was -47 mJ (the negative number indicates output energy). The net energy (or input + output) was 26 mJ [because 73 + (-47) = 26]. Since the net energy is positive, this indicates that more electrical energy is going into the cell than is coming out of the cell. The ratio of output power to input power (-output/input) was 0.64 which indicates under unity performance. BLP had a ratio of output power to input power that was greater than 10 for their cell having a Molybdenum anode. The power to heat the cell up to 450 C is not considered in input or output power measurements. This is because a scaled up system would have an electrical output in the kilowatts range and require a small percentage (BLP claims less than 1%) of that power to heat the system up to 450 C.
Future Experiments
Future experiments will vary the output load resistance (R3 in Figure 1) and also vary the amount of water in the electrolyte (by varying the water vapor introduced) in attempts to replicate the CIHT experiment. The concentration of water in the electrolyte is an important variable according to Blacklight Power.
Conclusion
The CIHT replication experiment was unsuccessful with an output to input ratio of 0.64 (i.e. the electrical output was 64% of the electrical input). This compares to Blacklight Power who had an output to input ratio greater than 10. It is speculated that one possible cause for the lack of replication is that the LiBr/LiOH/MgO electrolyte did not contain the proper concentration of H2O molecules. Based on Blacklight Power’s scientific papers, successful replication depends on the proper water concentration in the electrolyte, particularly near the anode. Future experiments will attempt to confirm this.
Speculation on possible causes of the lack of replication are:
1. The concentration of the water in the electrolyte is a key variable in the experiment based on Blacklight Power’s scientific papers and this unsuccessful replication may have an incorrect water concentration.
2. The anode is deep within the electrolyte at the bottom of a glass petri dish and the the water vapor needs to pass through a thin annular shaped area (or through the porous cathode mesh) to get to the anode. This could cause too much of a restriction to water vapor flow.
3. Potentially water is condensing at the top of the vessel where it is cooler and drying out the electrolyte. The top of the vessel may be between 70 C and 100 C (and condensing the water) while the electrodes and electrolyte is at 450 C at the bottom of the tall vessel.
4. The load resistance (R3 in Figure 1) was 12 ohms and possibly this should be either increased or decreased.
5. Some other unknown cause.
====================================================================
****Below is an old description of my plans for replicating the experiment.*****
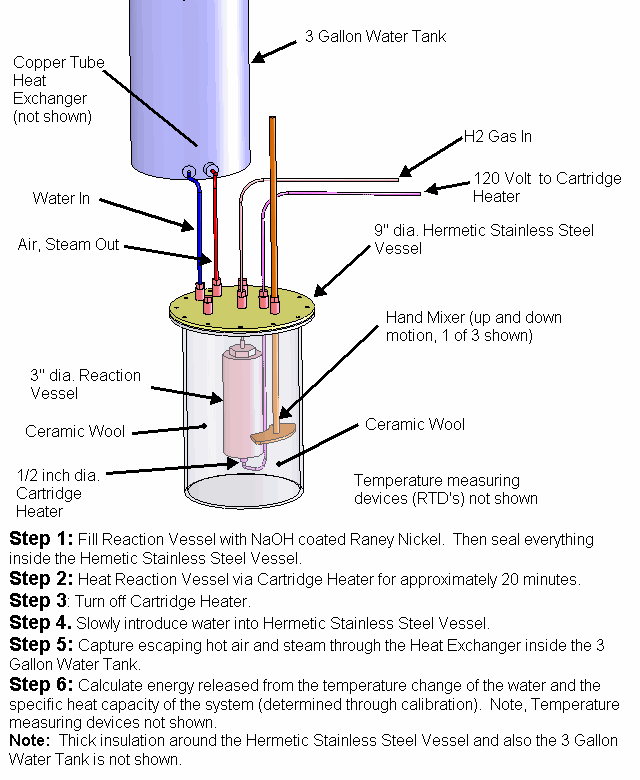
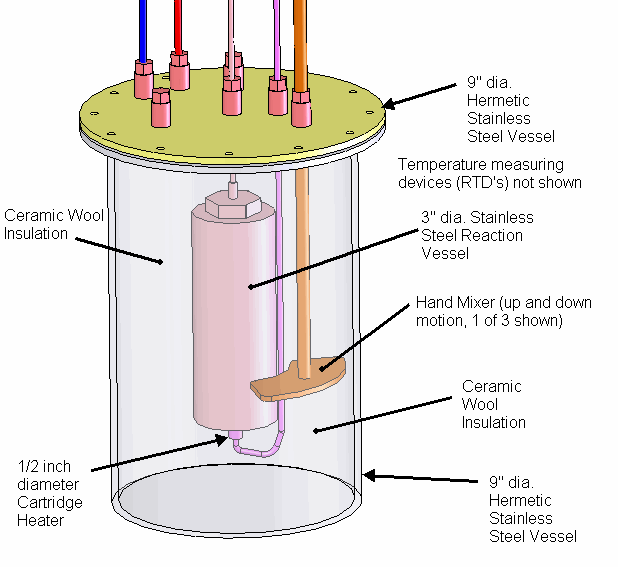
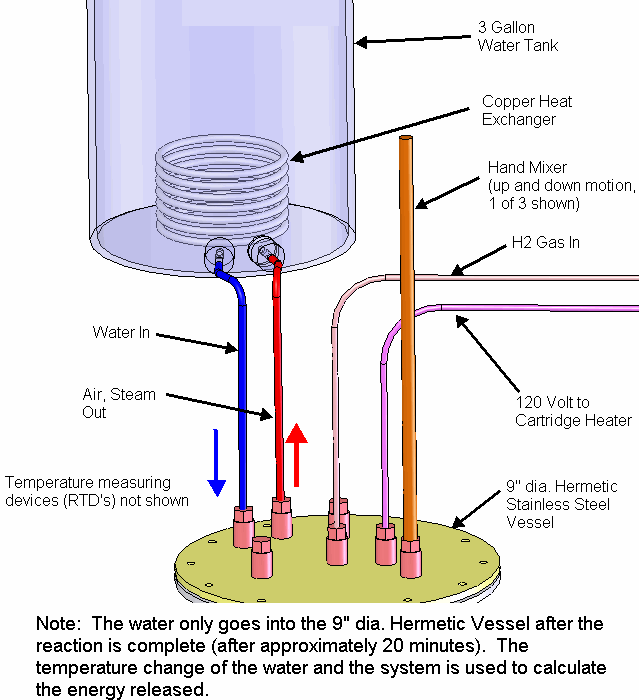
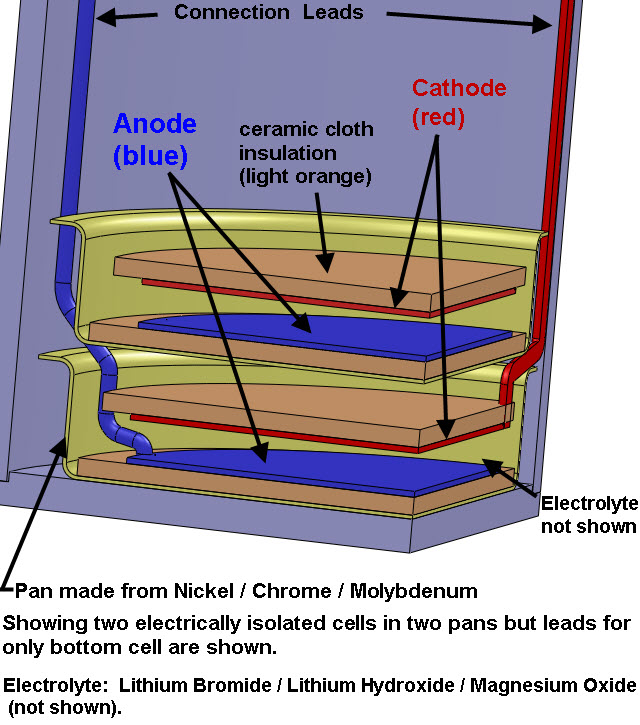
The pictures below show 2 pans containing 2 CIHT cells where the pans are the 2 pie plate looking components in the bottom of the vessel. There will be 8 pans total with one CIHT cell per pan. The CIHT cells will be connected in pairs for a total of 4 voltages that will be monitored. The total energy in will be compared with the energy out over a 30 day period.
My plan is to monitor the voltage, current and energy in/out using a custom built electronic circuit and data acquisition system.
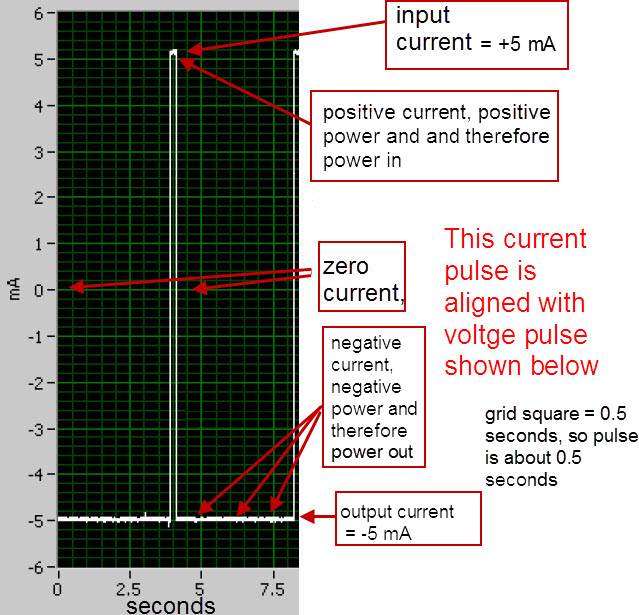
Each CIHT cell will contain a Nickel/Molybdenum/Chrome anode (Haynes 242 alloy) and an oxidized Nickel electrode. Note: the anode and the pans are made frome the same alloy (Haynes 242 alloy) but the pans are separated from the anode by a ceramic cloth. The electrolyte will be a Lithium Bromide / Lithium Hydroxide eutectic (LiBr/LiOH) with a melting point of 275 C and also contain Magnesium Oxide. A small quantity of water vapor will flow through the cell along with Argon gas. The stainless steel vessel with conflat seals containing the CIHT cells will be heated to 450 C. A constant current pulse of 5 mA will be applied to the cells until the voltage reaches 0.8 V per cell (typically less than 0.5 second). The cell will then be discharged at a constant current of 5 mA until the cell reaches 0.6 V or until 4 seconds is reached. The electrical energy in will be compared with the electrical energy out. The energy required to keep the device at 450 C is not considered in the energy balance since, according to BLP, a device that is scaled up to 3.3 kW electrical output will need less than 1% of that energy to keep it at 450 C if it is well insulated. BLP claims more than 10 times the electricity output compared to the electricity input.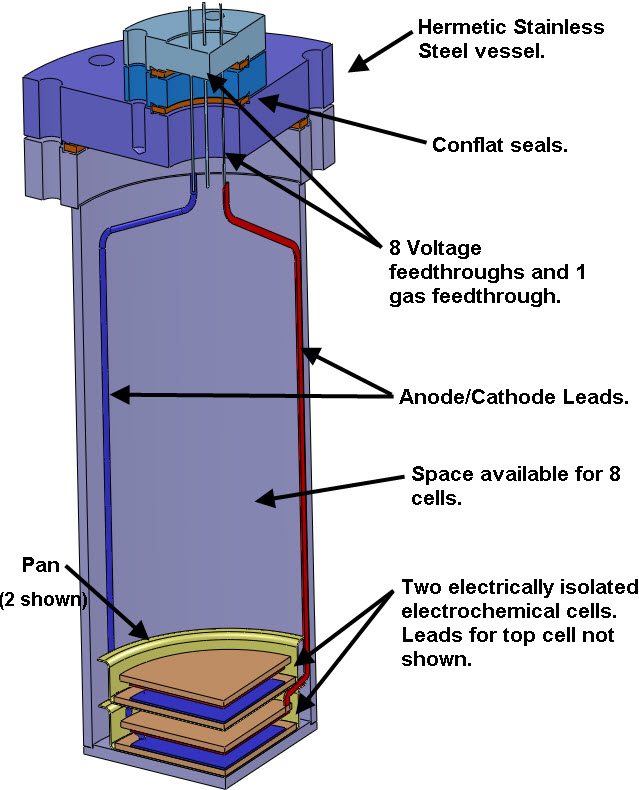
The input energy is a +5mA constant current pulse less than 0.5 seconds. The output energy is a longer pulse of 4 seconds at -5mA constant current (achieved using a device to keep the current constant). The portion of the current pulse that is positive is deemed the “energy in” while the portion of the current pulse that is negative is deemed the “energy out“. The voltage is always positive – ranging between 0.6 and 1 V.
The current is multiplied by voltage to get power and a graph of the power has a positive portion and a negative portion.
The summed total of the positive portion will be the energy in and the summed total of the negative portion will be the energy out. BLP claims the energy out is more than 10 times the energy in.
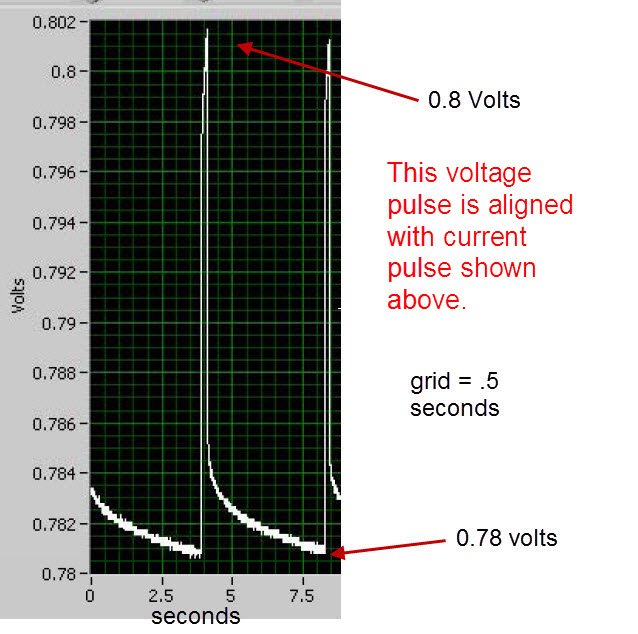
Below is data from BLP’s report on CIHT.
Note: The oscilloscope pictures above are from Blacklight Power’s scientific paper on CIHT. The electric circuit diagram below is my proposed method of measuring the input and output power of the CIHT cell and will not require any use of a constant current source or sink.
============================================================
============================================================
============================================================
============================================================
============================================================
============================================================
Below is an experiment that I have postponed so that I can do the CIHT replication experiment shown above.
============================================================
HeterogeneousHydrinoCatalystCITUPDS.pdf
==================Correction ======================
I do not plan to do the experiment with the chemicals as listed above (Sodium Hydride and Raney Nickel). I actually plan to choose one of the 4 formula combinations (recommended to me from Randell Mills in 2010) as listed below:
(A) KH, Mg, TiC, AgCl
(B) KH, Mg, TiC, EuBr2
(C) KH, Mg, TiC, MgF2
(D) NaH, Mg, TiC, LiCl
where KH = Potassium Hydride, Mg = Magnesium, TiC = Titanium Carbide,
LiCl = Lithium Chloride, MgF2 = Magnesium Flouride , EuBr2 = Europium
Bromide, AgCl = Silver Chloride

